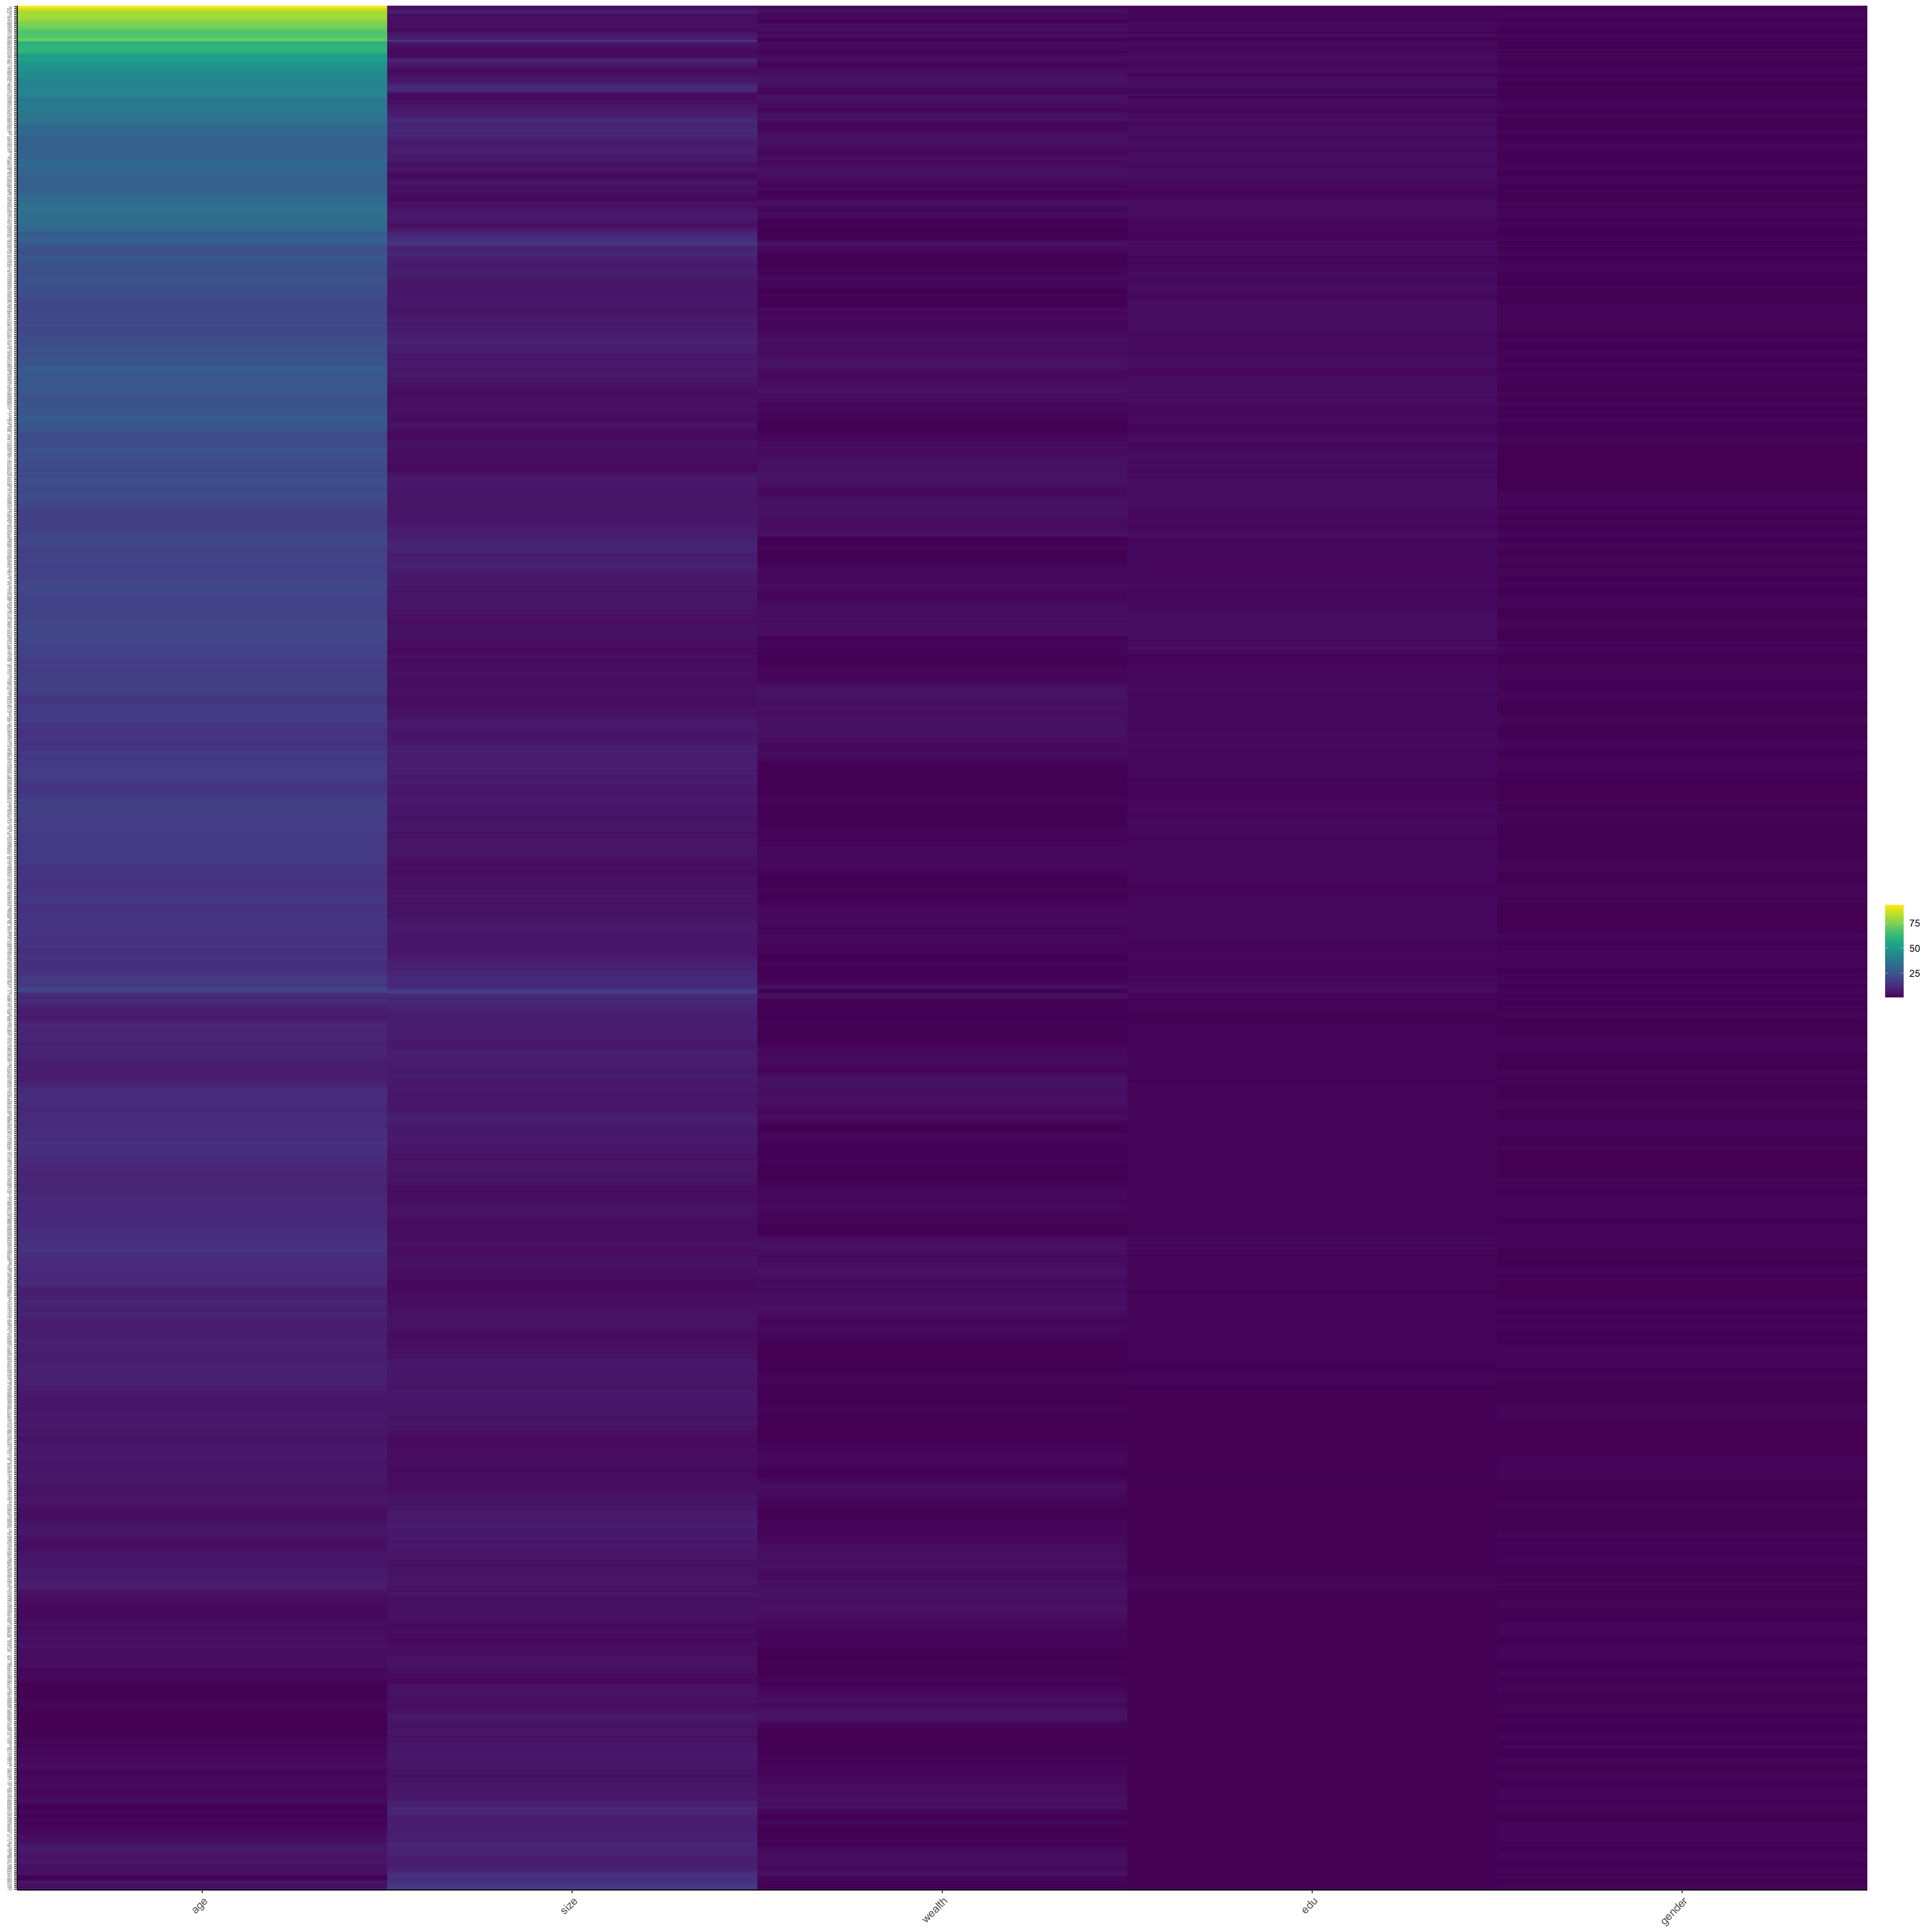
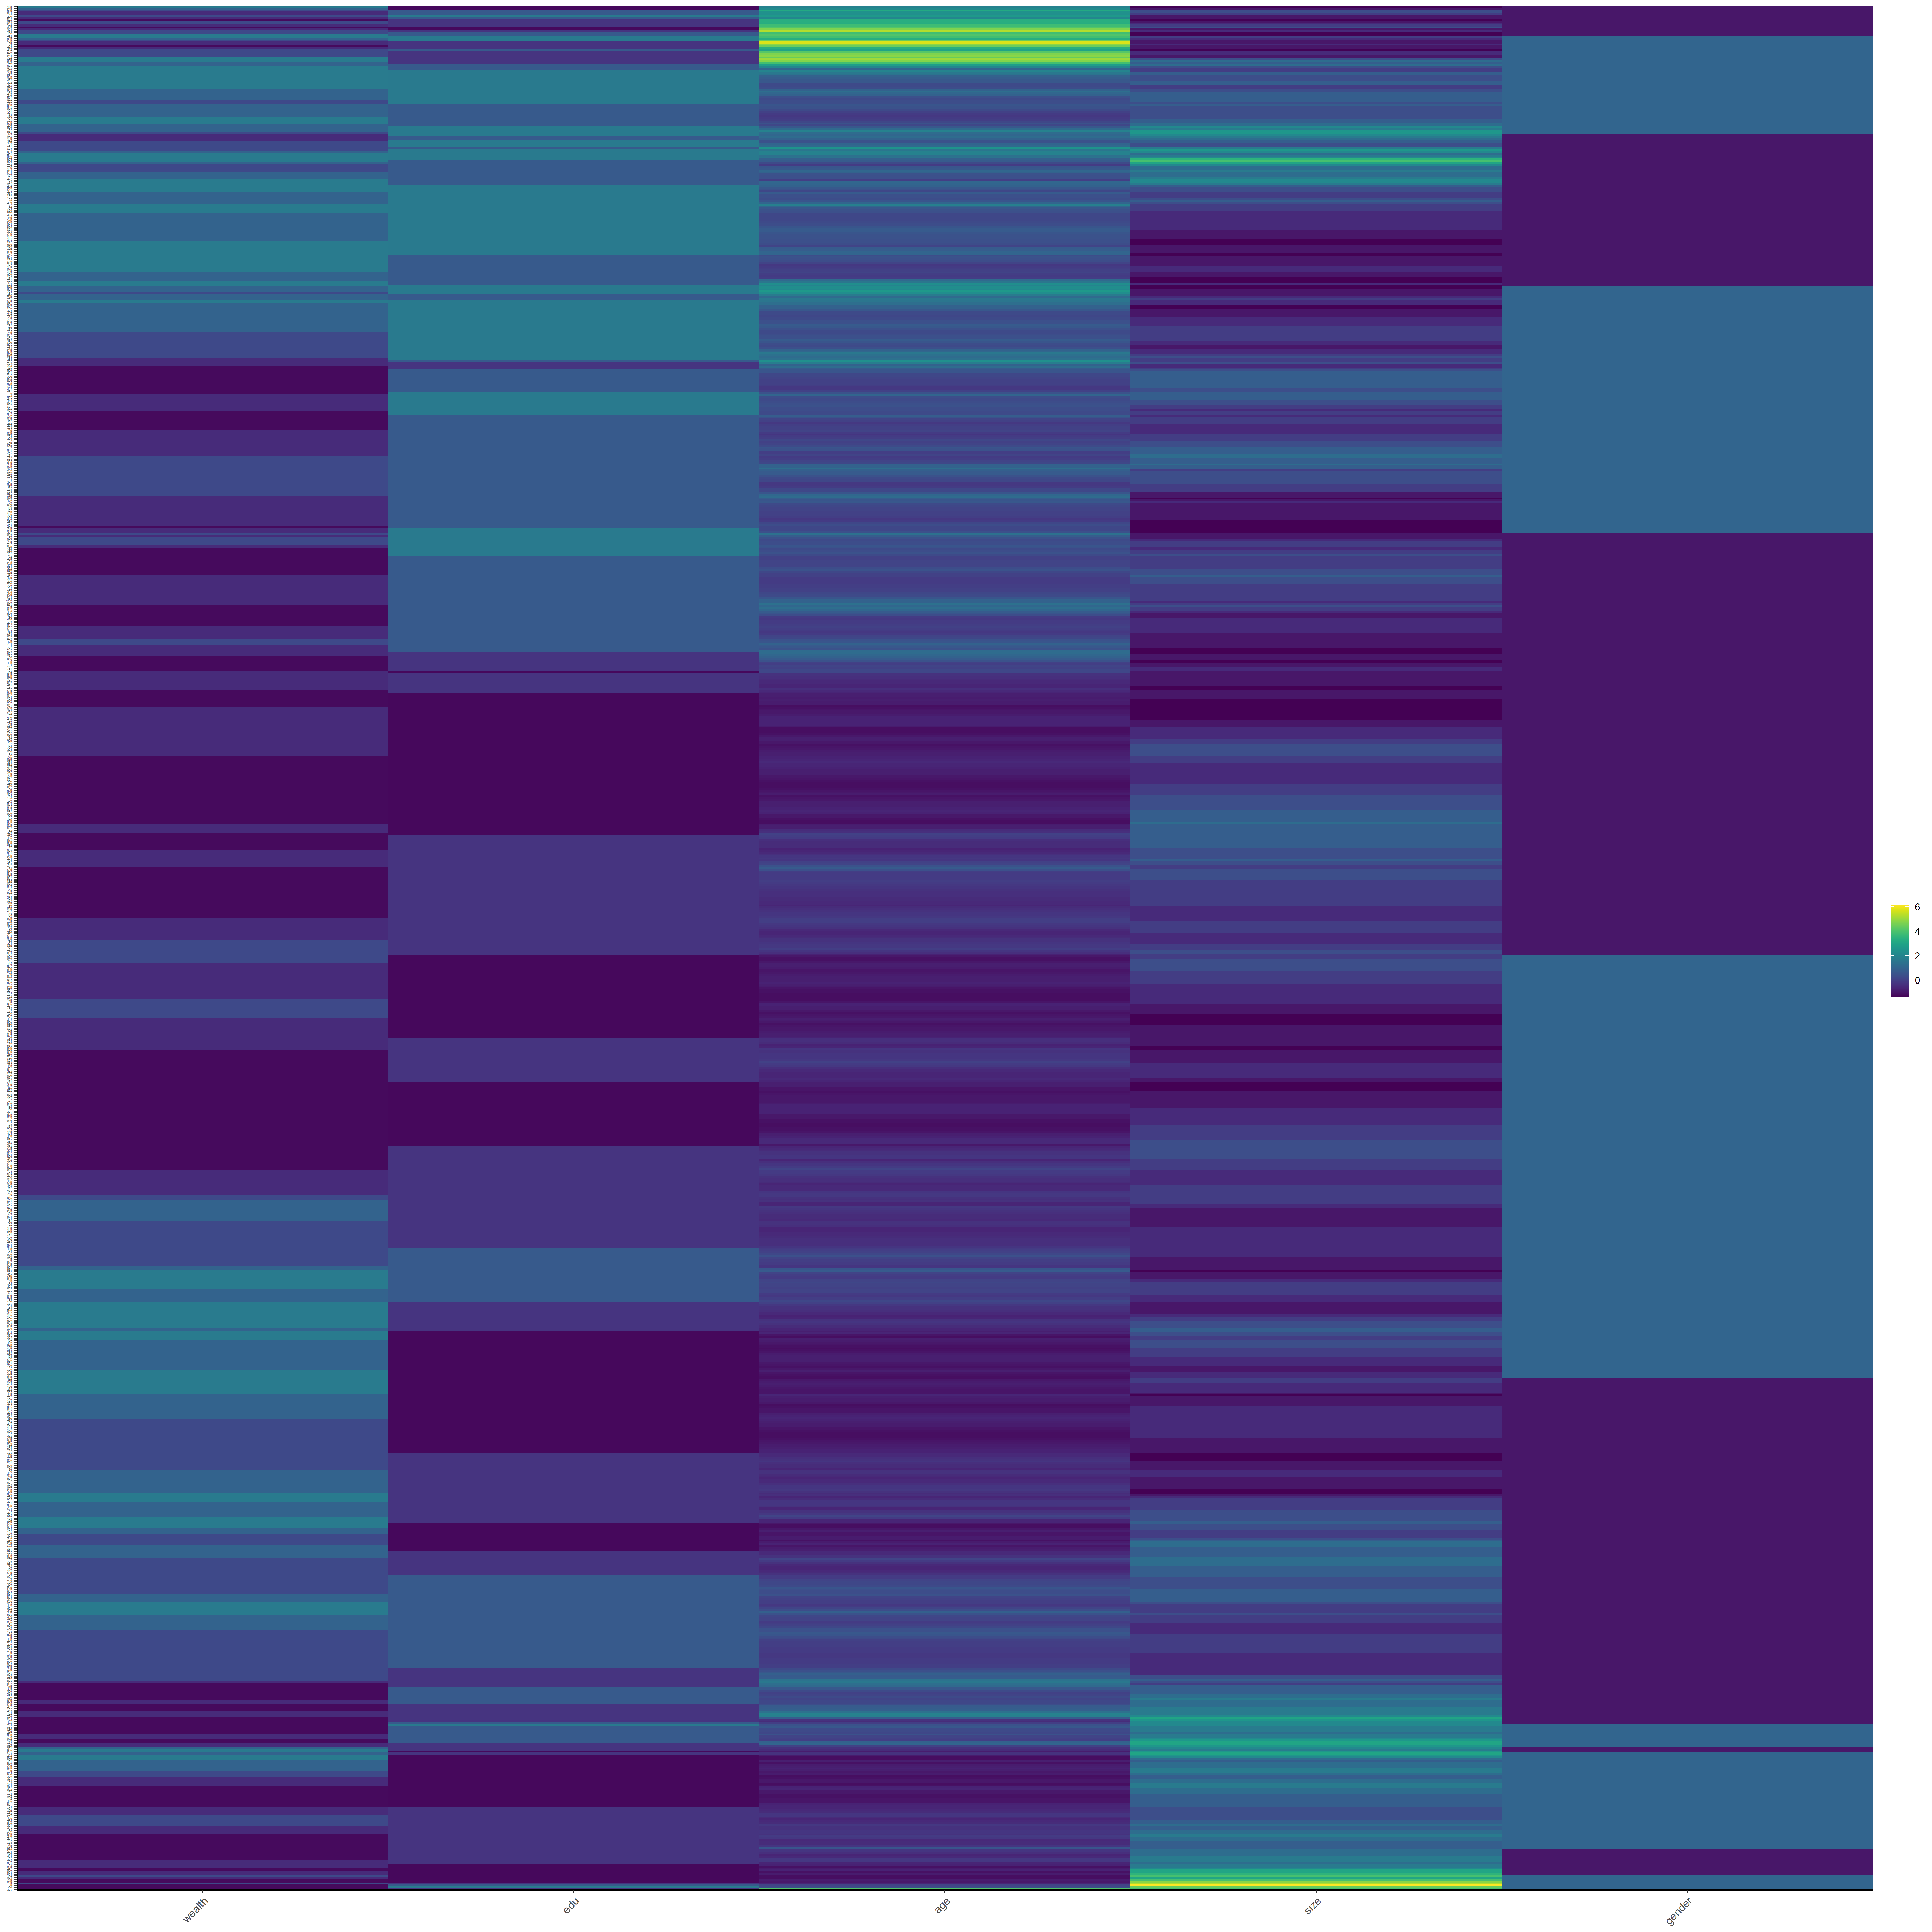
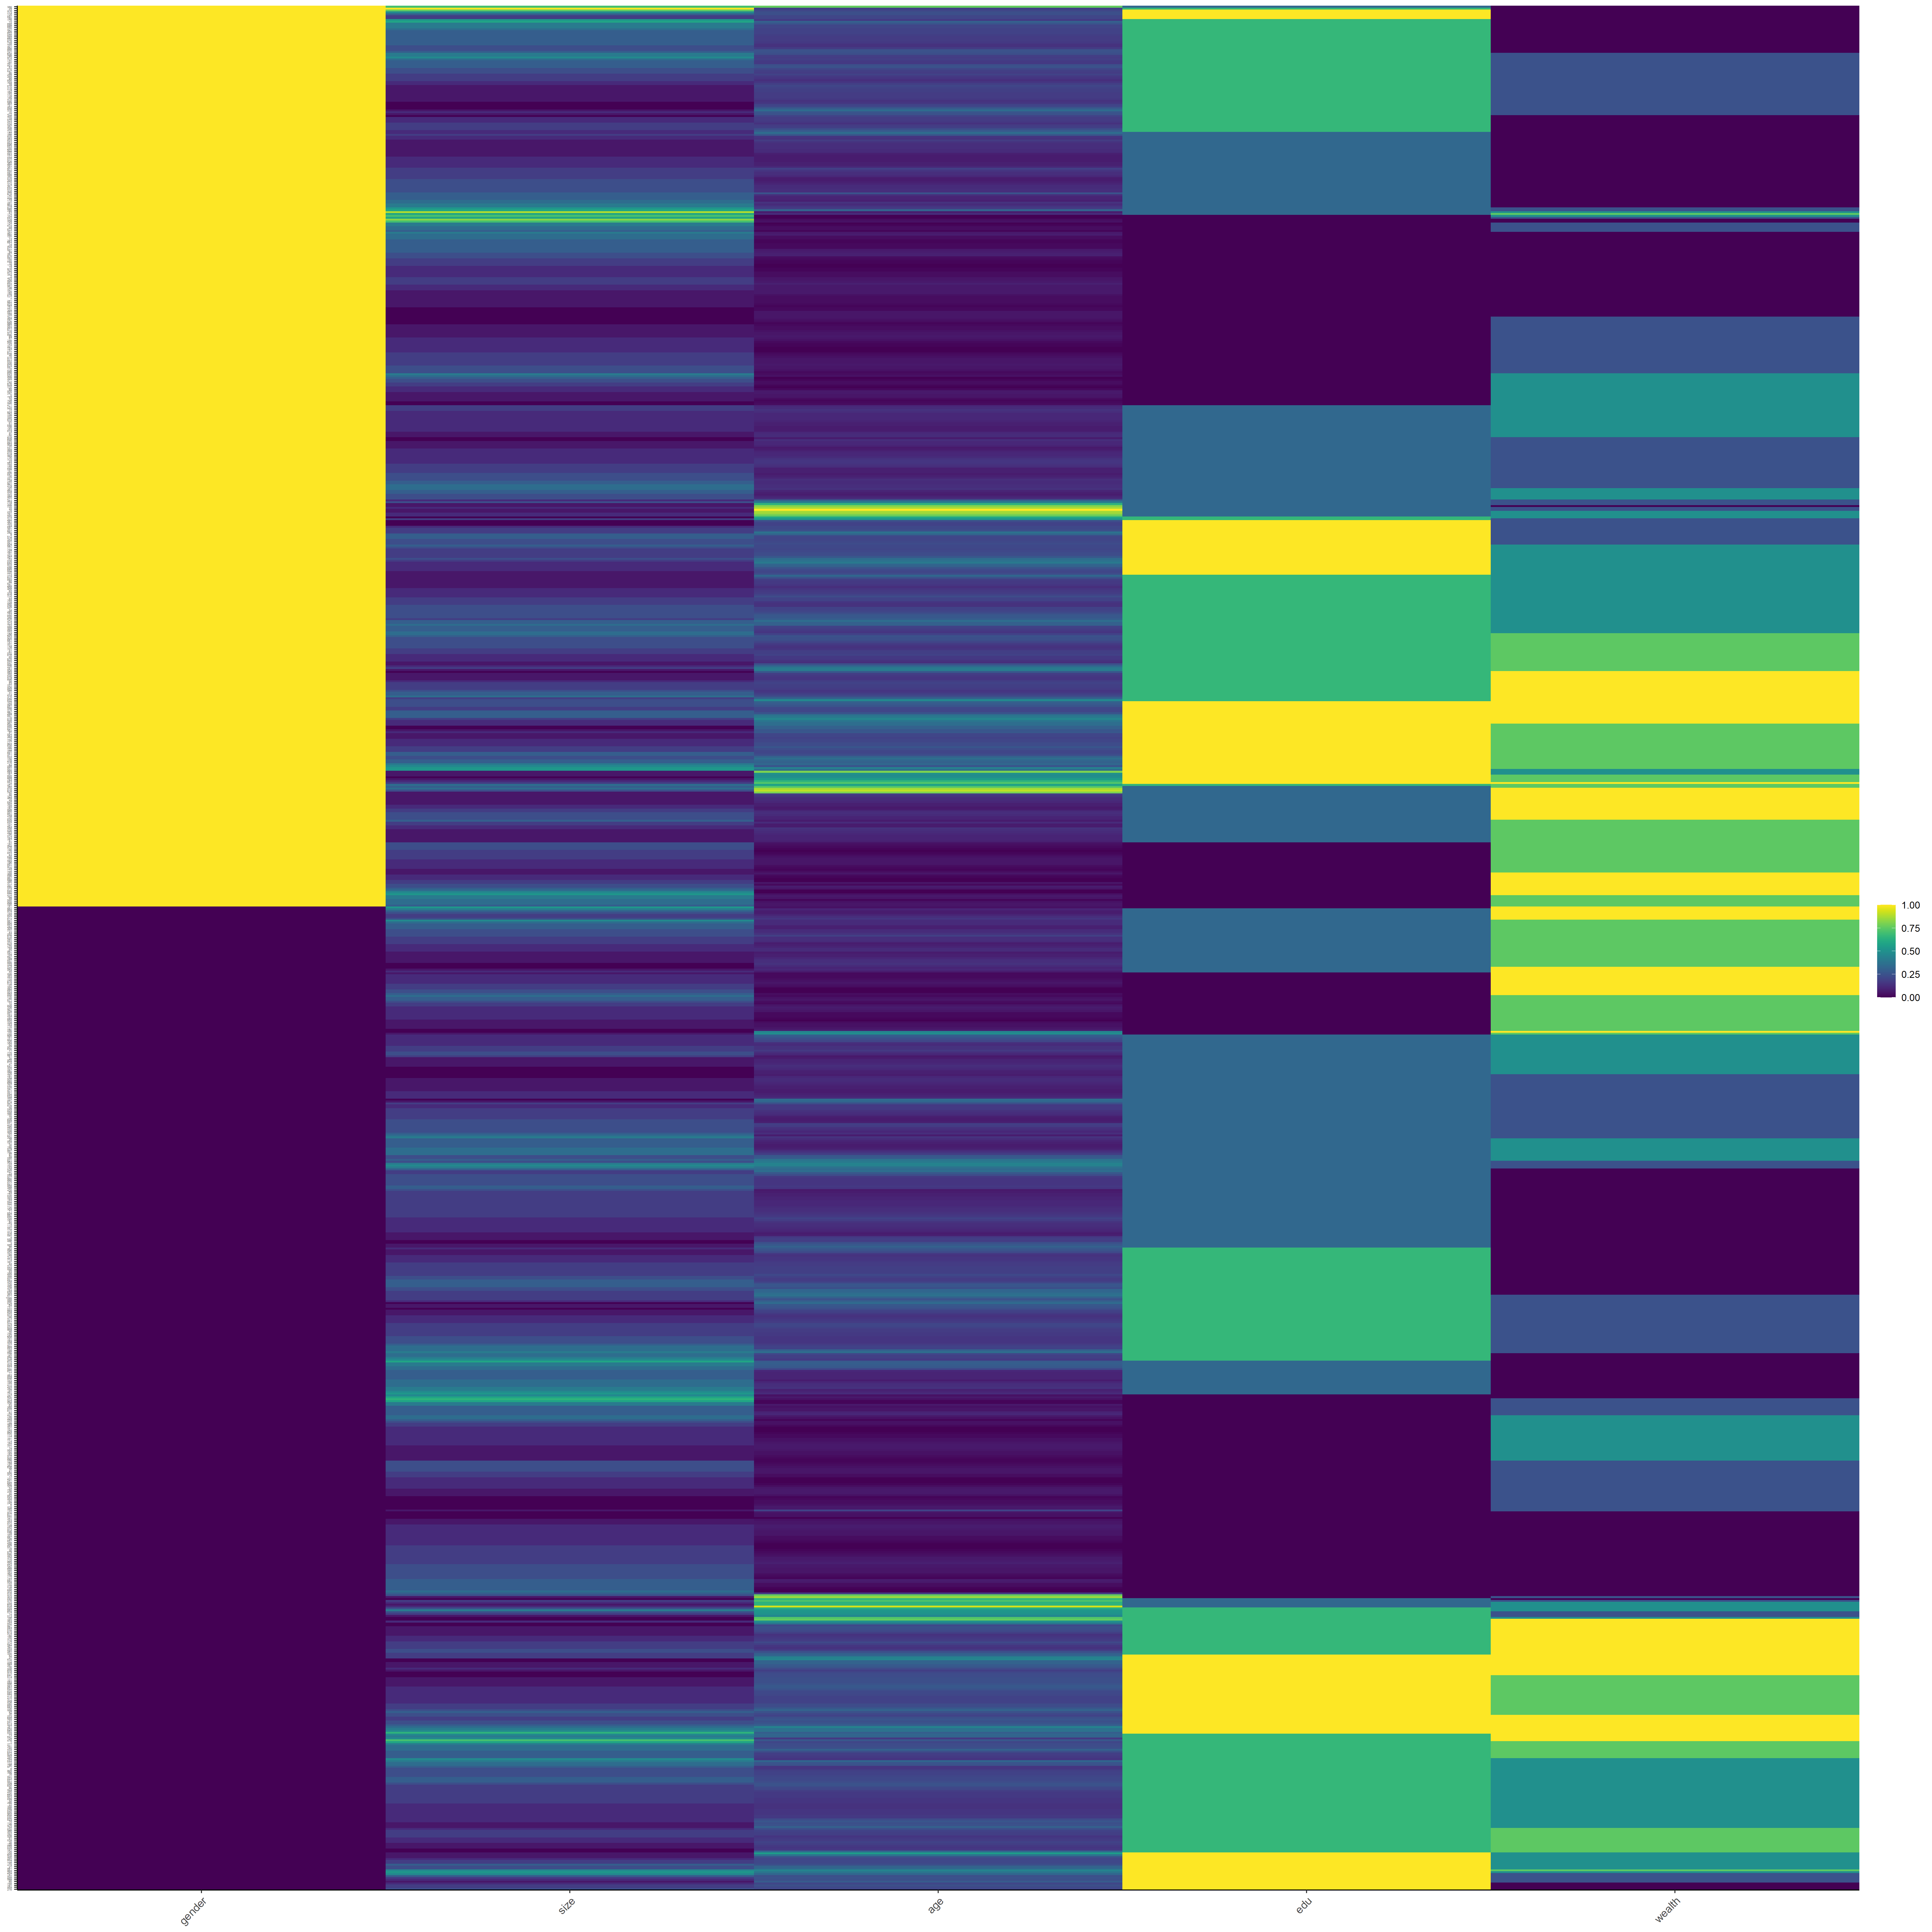
I created four different heat maps using DHS data. The variables I am mapping are: size, gender, age, education and wealth. I produced heat maps for the raw, standardized, normalized, and percentized data.
Below are the heatmaps I created:
| Heat Map of Raw Data | Heat Map of Standardized Data |
|---|---|
 |
 |
| Heat Map of Normalized Data | Heat Map of Percentized Data |
|---|---|
 |
 |