I scraped 400 observations from Zillow pertaining to the housing market in Austin, TX. I selected Austin as the target city… for obvious reasons. Each observation contained 5 data points: ‘asking price’, ‘address’, ‘number of beds’, ‘number of bathrooms’, and ‘square-footage’. This data was condensed into a single CSV.
The independent variables: ‘number of beds’, ‘number of bathrooms’, and ‘square-footage’ were used to train a neural network to predict the dependent variable: ‘asking price’. The objective of this network was to determine whether the asking price for a particular property was reasonable. This was achieved by comparing the outputs from the network to the official asking price for the property.
The network was comprised of a single dense (fully-connected) layer contained one neuron with an input shape of 3. Initially I utilized SGD as the optimizer, however in later training iterations I utilized Adam as the optimizer. The loss function utilized for training was ‘mean squared error’.
The preprocessing of the data after scraping from Zillow was the most challenging aspect of this project. The ‘square-footage’ column in the resultant CSV from the scrape contained string values, which needed to be cast into int values for the purpose of network training. Generally, this is a straight-forward operation. However, there were 10 data points in the ‘square-footage’ column that could not be cast into numeric values (int, float). The source of this error was too difficult to identify. I was able to circumvent this issue by implementing the following block of code:
  homes = pd.read_csv('zillow_data.csv')
  homes['sqft'] = pd.to_numeric(homes['sqft'], errors='coerce')
  sqft_mean = np.mean(homes['sqft'])
  homes = homes.fillna(sqft_mean)
The first line of code reads the CSV into a Pandas Dataframe. The second line of code converts the ‘square-footage’ column in the Dataframe to int values. The “ errors=’coerce’ “ argument in the second line makes the 10 data points that could not be cast to numeric values into ‘NaN’ values. The third line of code calculates the mean value of ‘square-footage’ for all of the data in the Dataframe. The fourth and final line of code replaces the 10 ‘NaN’ values created in line two of the code, into the mean ‘square-footage’ value of the data. This was done because the network was unable to train on data with ‘NaN’ values. While replacing the ‘NaN’ values with the mean likely skewed the data somewhat, it was the only way that the network could successfully train on all 400 observations. I used the mean value of ‘square-footage’ because it would best mitigate any inaccuracies resulting from this augmentation.
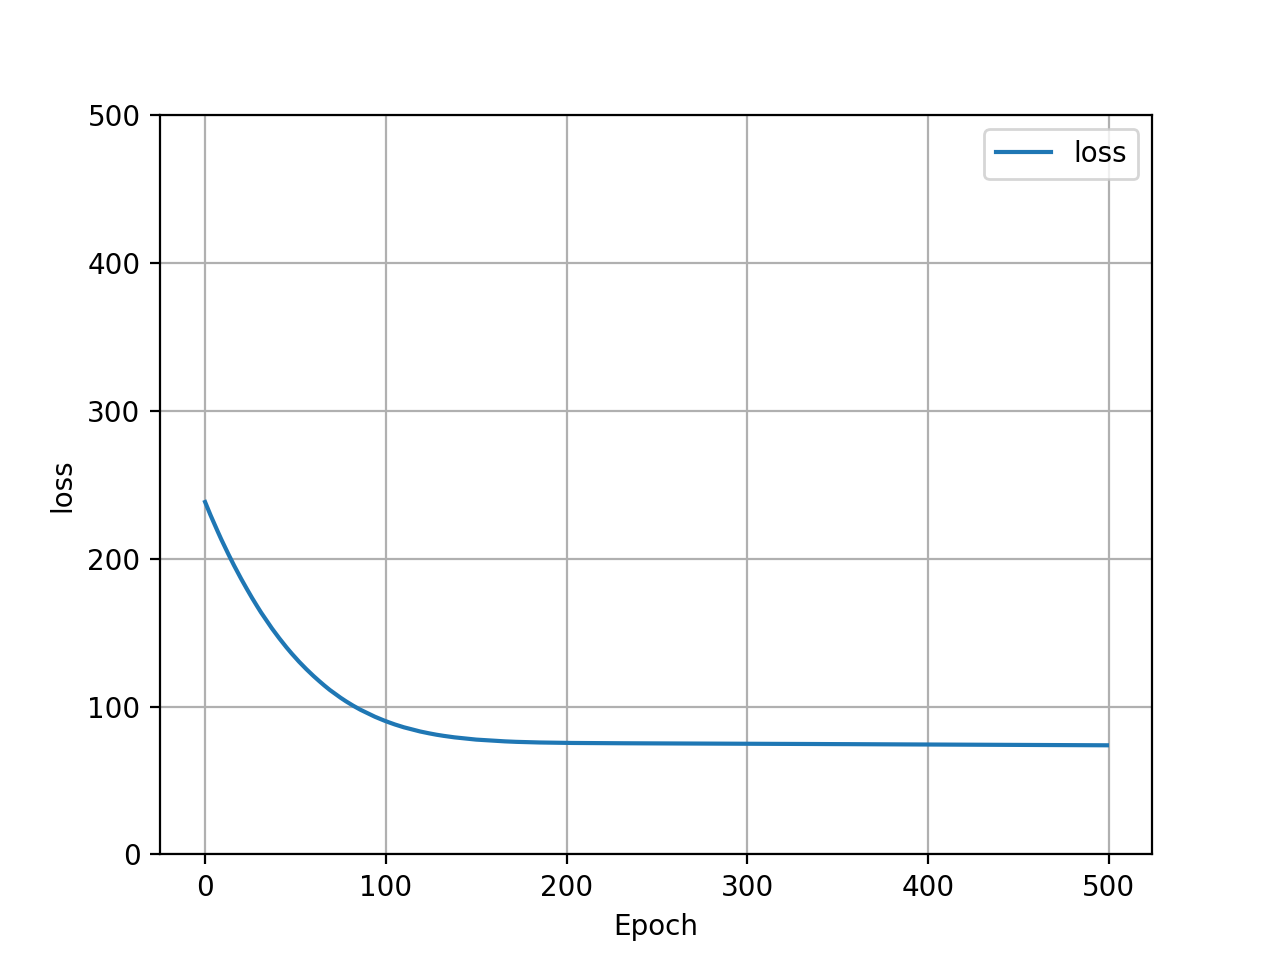
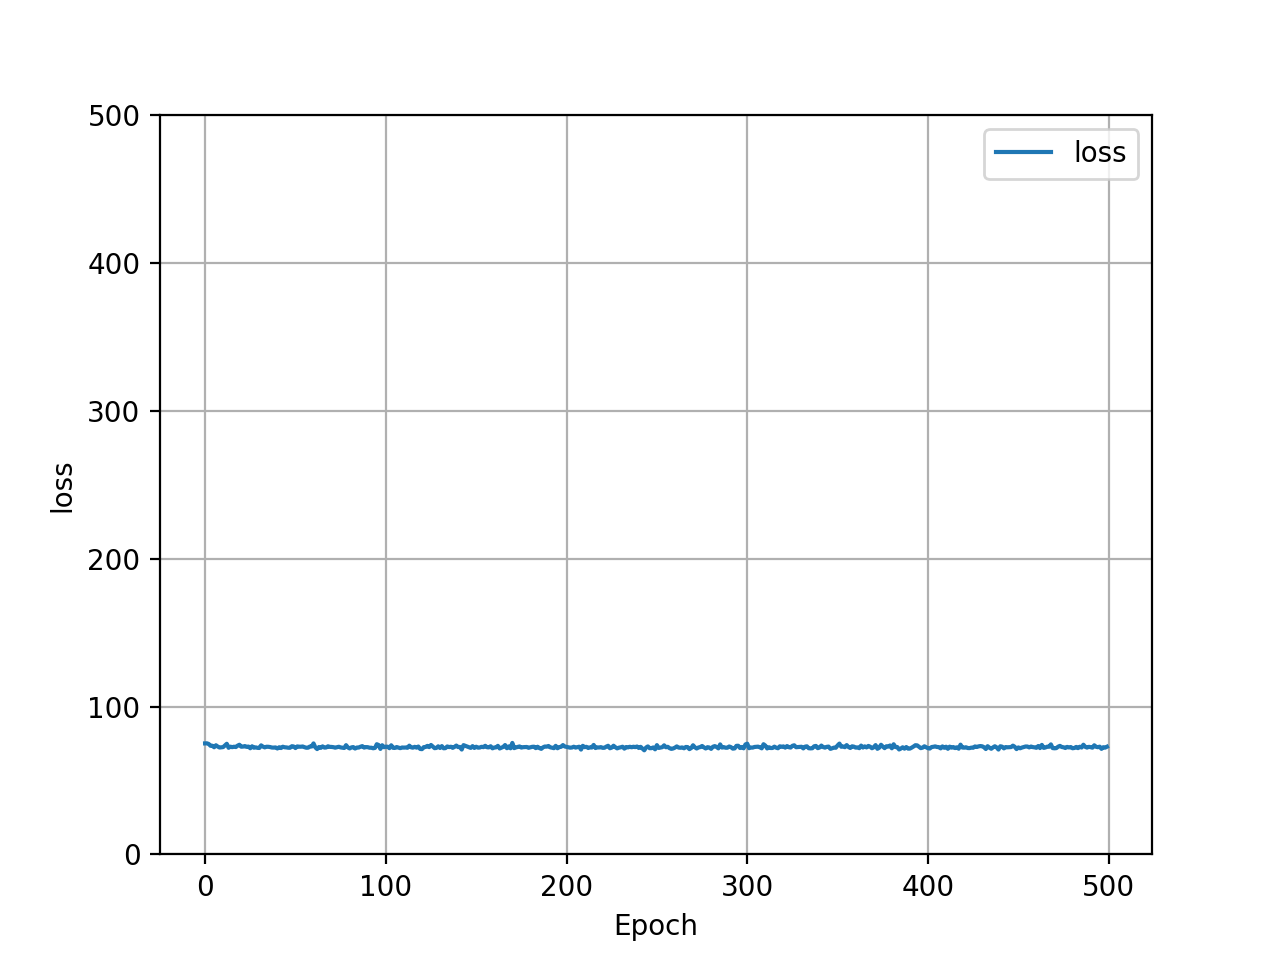
Here is a graphical comparison of Adam and SGD optimizers impact on the loss of the model:
| Adam Optimizer - Loss Graph | SGD Optimizer - Loss Graph |
|---|---|
 |
 |
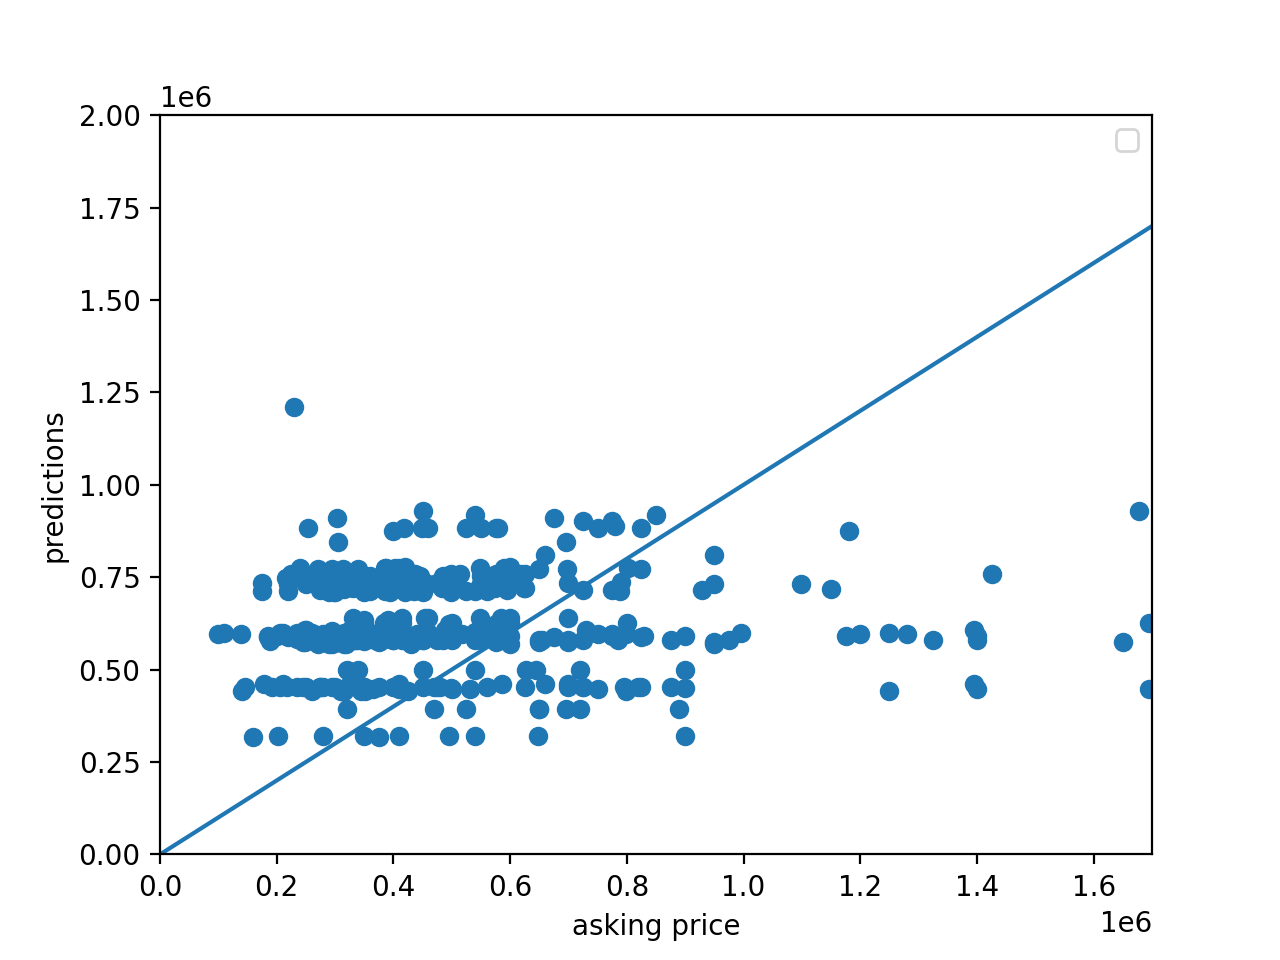
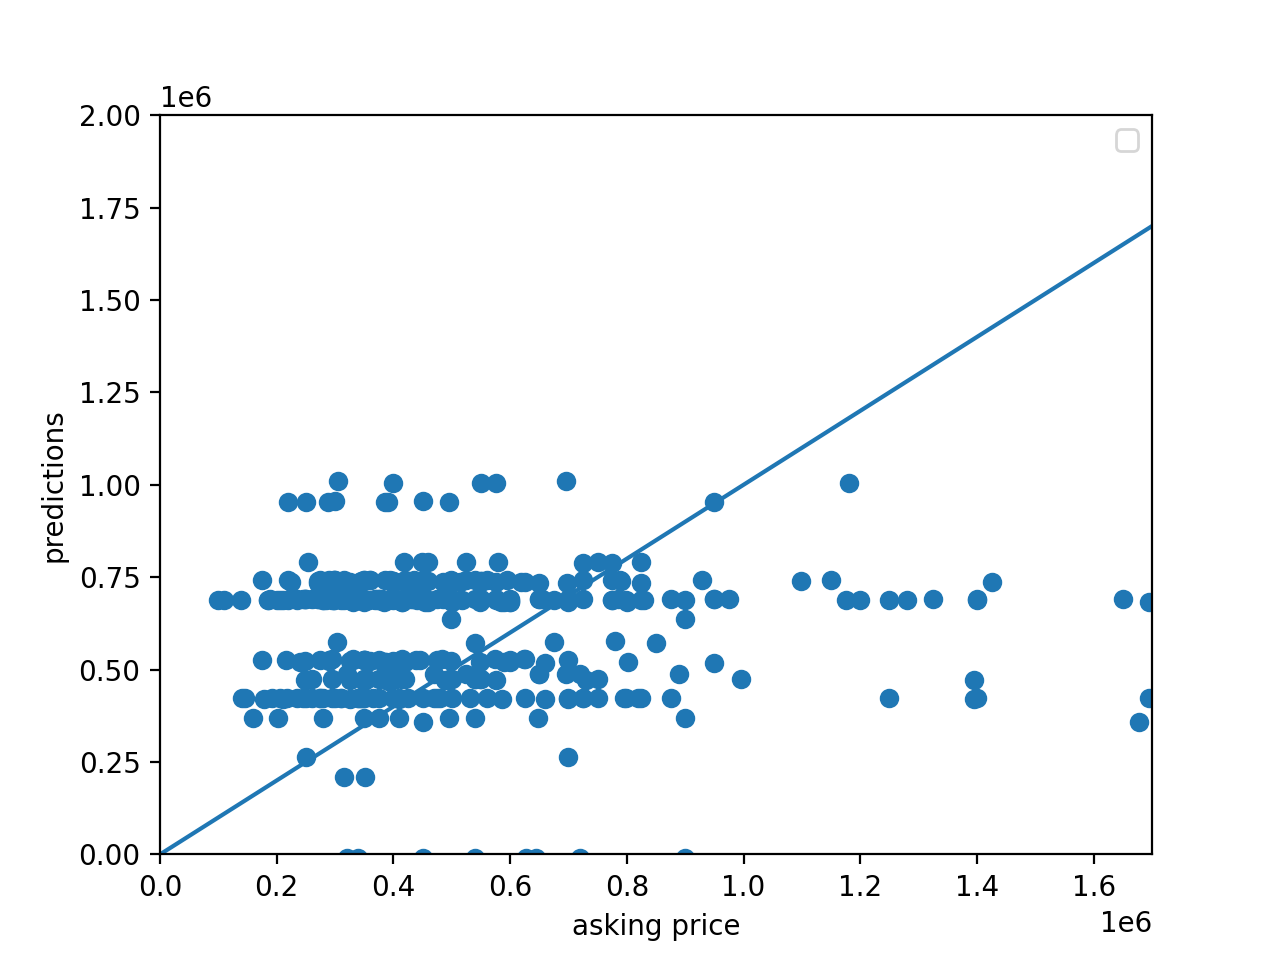
Here is a graphical comparison of Adam and SGD optimizers impact on the model’s predicted price:
| Adam Optimizer - Price Scatter Plot | SGD Optimizer - Price Scatter Plot |
|---|---|
 |
 |
Based on these outputs, it looks as though the two optimizers performed equivalently. This was most likely due to the complexity of the target function and the relative simplicity of the model. As a result of this, variance in the optimizer had little to no impact on output improvement. This would likely start to impact the effectiveness of the output with a more complex model. One interesting variation between the two optimizers was Adam’s initial poor loss performance, and quick improvement. SGD on the other hand started with a lower loss and improved only minorily, if at all. Both optimizers completed 500 epochs with approximately the same loss value. In addition to this, it appears as though Adam produced a more densely clustered price prediction output than SGD. SGD had more outliers towards the bottom and far right of the scatter plot.
In addition to using different optimizers, I also utilized different scalers.
Here are the results on the network’s final Mean Squared Error based on four different scalers:
- Raw Data : The Mean Squared Error is 712637506427.6313
- Standard Scaler : The Mean Squared Error is 711190659063.013
- Min/Max Scaler : The Mean Squared Error is 746906436004.5992
- Robust Scaler : The Mean Squared Error is 1155790503522.1743
Here is the ranking of the of the house sales in Austin:
The ranking was determined by subtracting the network’s predicted value from Zillow’s listed value. The linked CSV is sorted based on best deal (lowest difference value). The lower the difference value, the better the deal. Negative difference values indicate the network predicted a higher sale price than the actual listing price, meaning that it is a good deal.